By Meteorologist Joe Martucci
You may have seen a number of articles come out in the first week of April with headlines like:
“Rising Sea Levels Will Threaten 323K+ In NJ By 2050, New Study Says: See The Map”
“Severe coastal flooding could threaten Wildwood, Ocean City, and A.C. by 2050, report says”
“New Study Projects Climate-Driven Flooding for Thousands of New Jersey Homes”
What do they actually mean? Why such a flurry of articles from reputable news sources? They sound kind of scary.
They all come from the release of Climate Central’s Coastal Risk Finder tool on March 31. Climate Central is a nonprofit organization based in Princeton, Mercer County, whose mission is to “address climate science, sea level rise, extreme weather and energy topics.”
I was fortunate enough to be asked by Climate Central to be a panelist for the public release of the product that Monday. More than 120 journalists and media meteorologists attended the virtual meeting to learn about the tool which forecasts future flooding and its socioeconomic impacts.
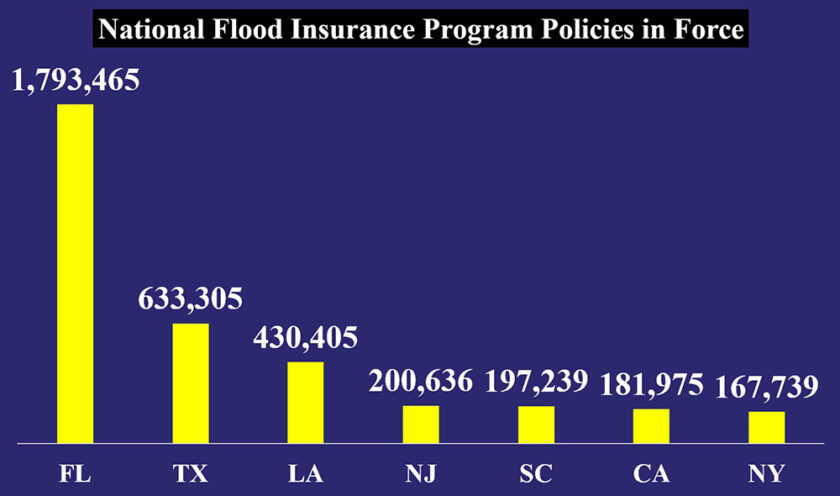
As of March, there are 200,636 flood insurance policies in force by the National Flood Insurance Program in New Jersey. That’s the fourth highest of the 50 states, ranking just above South Carolina. Furthermore, those policies cover over $50 billion worth of New Jersey property.
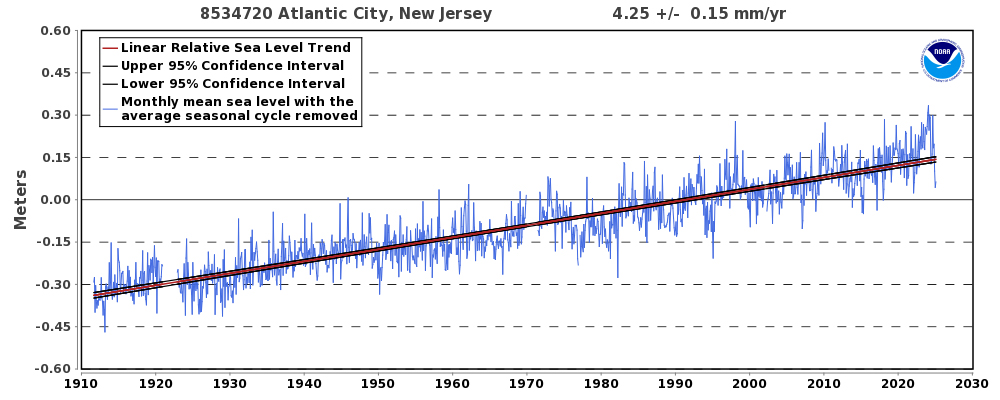
Below is a summary of what the Coastal Risk Finder shows for the present and future of the Jersey Shore, as well as how to use the tool. All of the data is based on an intermediate sea level rise scenario. This scenario lines up best with the options presented by Climate Central, in comparison with what has happened historically in Atlantic City, our primary Jersey Shore tidal location.
Interagency data from 2022 is the source for sea level rise projections used. Population is based on 2020 levels. To get the most out of the new tool, be sure to use a desktop or laptop computer.
Not much change in flooding impacts by 2030
According to the risk finder, 7.9% of people in Cape May County, and 1.9% of people in Atlantic City are at risk of water inundation in their homes at least once in 2030. That’s roughly what it is now. In other words, a flood 2.7 to 2.8 feet above mean higher high water (MHHW) floods the area at least once a year. MHHW is the average height of the two high tides seen per day.
By 2050, those impacts double in size
By 2050, according to the risk finder, 14% of people in Cape May County, and 4.8% people in Atlantic County are at risk from either sea level rise or a flood that happens once a year, on average.
This indicates a flood 3.2 to 3.4 feet above mean higher high water in Ocean City, which would involve most areas bayward of West Avenue, from Second Street to 18th Street. Compare that to 2030, where only areas bayward of West Avenue, from Third Street to Eighth Street, would be underwater.
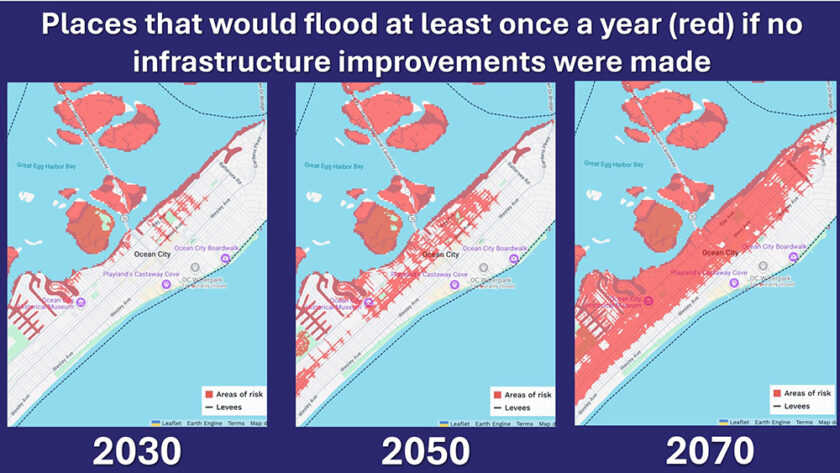
Our kids and grandkids could be at serious risk
Lastly, we’ll look at 2100. While most of us probably won’t be alive (I would be 109 then), our kids and especially grandkids would be around. That projects a vastly higher number.
According to the risk finder, 35% of people in Cape May County, and 16% in Atlantic County would flood at least once a year. When considering just the shore towns, that number jumps to at least 65% of Ocean City and the Downbeach towns would flood during a flood that’s 5.2 to 6.1 feet above MHHW.
Using Ocean City again, nearly everywhere bayward of Central Avenue would experience floodwater at least once a year. That’s nearly all of the island. Most of the Ocean City Municipal Airport would be included in that, too.
What else to consider
Your town’s emergency managers, elected officials and administrators take pride in protecting your property from floodwaters. The New Jersey Coastal Coalition, for which I do work, brings communities up and down the Jersey Shore together to share common sense flooding solutions. The result has been a reduction in your flood insurance premiums.
Ocean City is eligible for a 30% rate reduction this year. Longport, Linwood, Margate and Ventnor have all earned 25% off. Somers Point has earned 20% off.
All of this is through the Federal Emergency Management Association’s Community Rating System (CRS) program. Through a combination of public information, mapping, regulations, flood damage reduction, as well as warning and response programs, your communities earn points toward rate reduction. For example, Avalon saved residents $1.6 million in 2020, and each year going forward, by going up a class rating.
The data and projections shown on the Coastal Risk Finder do not take into account future actions your town will take to increase their CRS score. It also doesn’t consider other actions being considered by towns and the state such the NJ Resilient Environments and Landscapes program.
How to navigate the Coastal Risk Finder
First go to www.climatecentral.org. Then go to Tools and select “Coastal Risk Finder” from the dropdown.
On the left-hand side, you’ll be able to select your town, county or state. You can then select your scenario. You can view the risk by year, good for viewing what sea level rise projections will bring. Or you can view the risk by water level, which you could use to see how another Superstorm Sandy (search for 4 or 5 feet) would flood somewhere now.
If you select the risk by year, you then go to additional settings to find your scenario.
For purposes of this article, I used the sea level rise + annual flood under “projection type.” Then, for “sea level protection source” I used U.S. Interagency 2022.” Then I clicked on the “intermediate” sea level scenario.
Joe Martucci, a Certified Broadcast Meteorologist and Digital Meteorologist, is the President and Director of Meteorology for Cup A Joe Weather and Drone. You can connect with him at cupajoe.live.