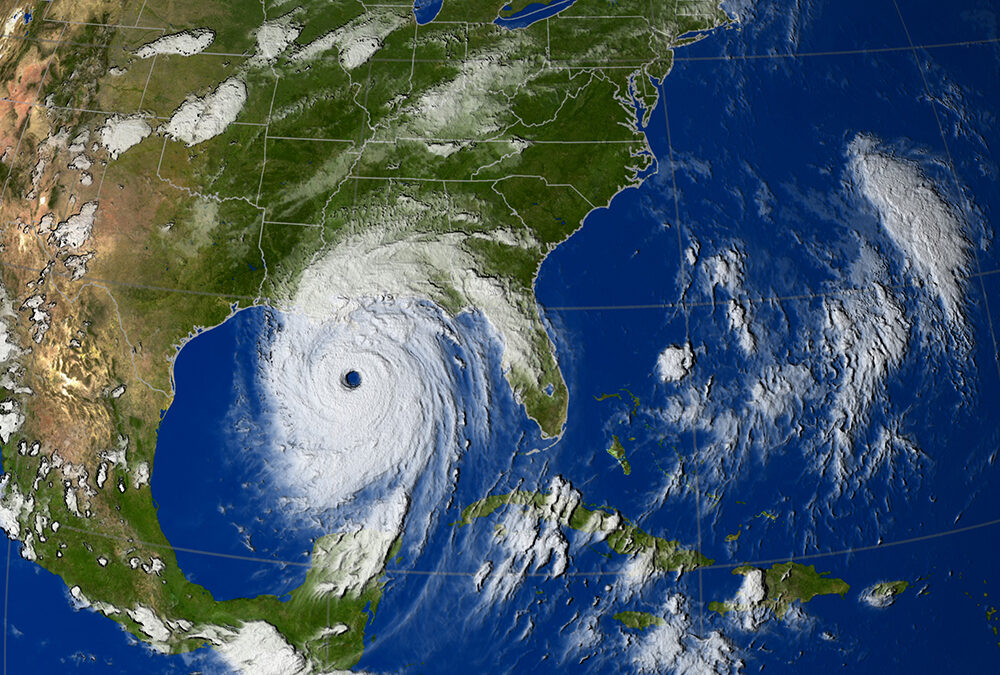
Hurricane season begins on June 1. Really, in New Jersey, we like to say that there’s a 12-month hurricane season. After all, it’s the water, not the wind, that causes the most devastation, and nor’easters bring plenty of water.
Sadly, the 30-year average for flood deaths is 113 a year, compared to 78 for winds in the United States, according to the National Weather Service. Safety, preparation and information are at the top of every meteorologist’s mind, including the fine folks at the National Hurricane Center in Miami, Fla. Every year they come out with new products, updates and changes to keep you as safe as possible from hurricane season, which will end officially on Nov. 30.
This year, there are six. They range from rip currents to wind forecasts, to the change in the size of the forecast cone that you see. Here are the updates below, including how you’ll be able to see them.
Inland watches and warnings on the
forecast cone map
The forecast cone is the essential part of understanding what is going on with a tropical system. The cone shows the forecasted path, along with data on location, movement, wind speed as well as watches and warnings.
Before 2024, only the coast was outlined in the applicable watches and warnings (Tropical Storm Watch, Hurricane Warning, etc.) on the map. However, these alerts often went well inland and there was no way to see that on the map.
Last year, the NHC added all areas that were in watches and warnings to the map, whether they were a coastal county or not on an experimental basis. This year, they continue to keep it, but “will now contain the symbology for areas where a hurricane watch and tropical storm warning are simultaneously in effect (diagonal pink and blue lines).
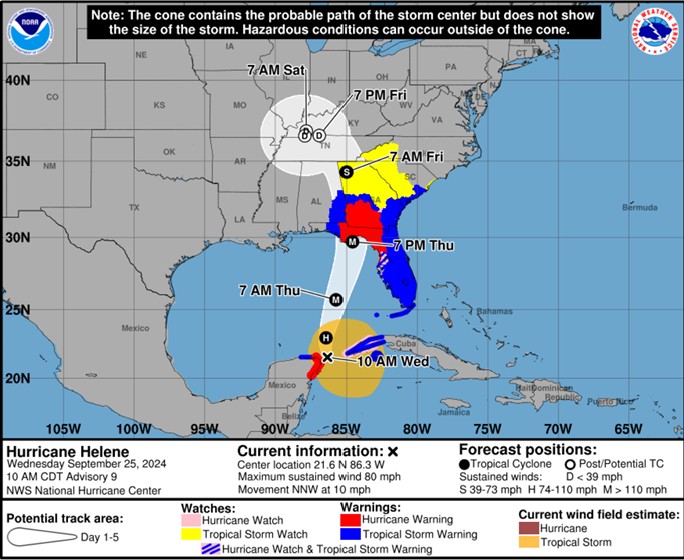
So, if the Jersey Shore counties were in a hurricane warning, and the inland New Jersey counties were in a tropical storm warning, all of the counties would be colored in on the map. If Atlantic County were in a hurricane watch and tropical storm warning, it would have a diagonal pink and blue line over the county. This came in handy during Hurricane Helene last September. Tropical storm watches were in effect as far inland as western North Carolina.
Before 2024, you would only know that if you lived in those counties, saw a news segment on it, or dug deep into the National Hurricane Center website. However, last year, you could see it right on the map. Of course, Helene brought catastrophic flooding to western North Carolina — $79 billion in damages were estimated to have occurred, according to the National Hurricane Center.
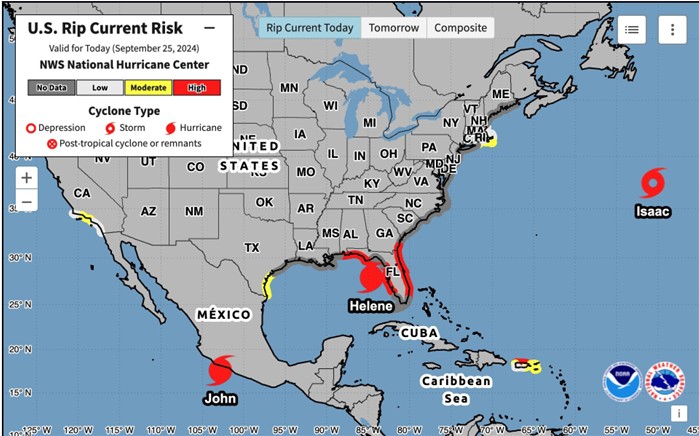
Rip current risks shown
When a tropical storm or hurricane is active in the Atlantic Hurricane Basin, the National Hurricane Center will provide rip current risk information on a national map. This also includes places like Puerto Rico and Guam.
The rip current risks will be provided for the day of and the next day, along with a map showing the highest risk over the next two days. This is really for people who want a more national view of what’s happening.
Our National Weather Service local offices have put out rip current and surf information for years. You can also check out my Sea and Sand video forecasts for Jersey Shore specific information. However, this is a great way to see the risks in one place.
More lead time for undeveloped storms
June, July, October and November can bring tropical storms or even hurricanes that quickly develop and make landfall on the East Coast. Tropical Storm Fay made landfall at the Edwin B. Forsythe National Wildlife Refuge at the far southern end of Long Beach Island at around 4 p.m. on July 10, 2020. It became a tropical storm just 23 hours earlier. However, the hurricane center knew Fay would hit New Jersey as a tropical storm even before it became a tropical system.
This update is for situations like this. The National Hurricane Center can issue tropical cyclone advisory products, like forecast updates, watches and warnings, 72 hours before the storm surge or wind hit land, regardless of the storm’s status at the time. Last year, it was 48 hours. So, this is an extension of it.
Extended wind
radius forecast
The category of a tropical system is based upon the maximum sustained wind speed. However, tropical storm force winds (39 mph or greater) or hurricane force winds (74 mph or greater) can extend for long stretches beyond the core of the storm.
You have to dig through the hurricane center’s website for it, but they do forecast the size of tropical cyclone wind fields in each of the storm’s four quadrants: northeast (most destructive part), southeast, southwest and northwest).
In the past, the hurricane wind radius forecasts went out 48 hours. This year, it will go out 72 hours, a testament to the improving accuracy of hurricane forecasting. To find this, search for the “Tropical Cyclone Forecast/Advisory product” when a storm is active. It’s abbreviated as TCM, too.
Forecast track
cone will shrink
Most of the above updates are due to the impressive work done by the meteorologists at the National Hurricane Center. Hurricane forecasts have become better with time, allowing more useful information to be given to you, with bigger lead times.
Each year, the hurricane center updates the size of their track forecast error cone. This is based on the accuracy of the storm’s track over the past five years.
This year, the size of the cone for the Atlantic Hurricane Basin will be smaller at seven of the nine forecast periods from 3 to 120 hours out. This includes all periods 24 hours and later. The most significant will be a 6% reduction in size for the 60-hour and 96-hour forecast.
As an example, a larger cone in 2024 could have Atlantic City on the edge. However, thanks to this improvement, Atlantic City could be out of the cone. That has huge implications for emergency management operations, evacuations and more.
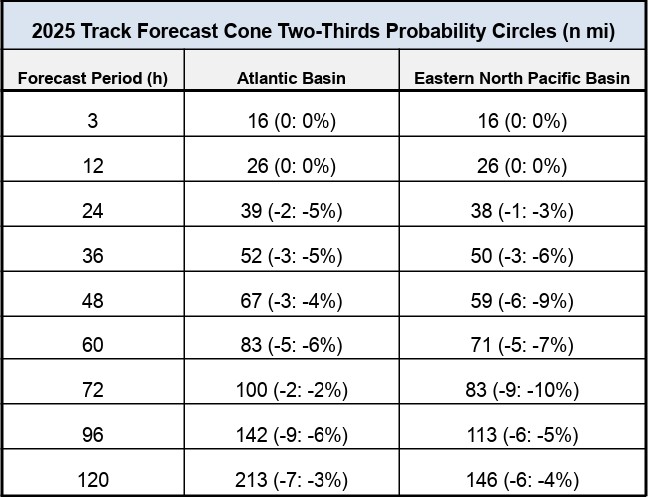
The forecast cones show where there’s a 66% chance of the storm’s center making landfall. This is important. It does not indicate where the impact of the storm will be, and it’s not guaranteed. Again, though, the National Hurricane Center has made big gains in forecasting the track of tropical storms and hurricanes.
Major update to
Hawaii forecasts
The likelihood of a certain height of storm surge hitting a coastline is now operational in Hawaii. It’ll be initiated by the National Hurricane Center’s Storm Surge Unit and made available within 72 hours of hurricane impacts. Storm surge forecast maps began on the mainland United States in 2016.
If you go to my YouTube or Facebook pages (@JoeMartWx), catch a special interview with Michael Brennan, director of the National Hurricane Center. It’s all part of the Tidal Flooding Talk show I co-host with Dan Skeldon (a familiar name to many), and Palma Shiles as part of the New Jersey Coastal Coalition. When you have 30 minutes, give it a watch or listen.
Joe Martucci, a Certified Broadcast Meteorologist and Digital Meteorologist, is the President and Director of Meteorology for Cup A Joe Weather and Drone. You can connect with him at cupajoe.live.