The past 11 weekends at our beach towns graded a ‘B’ or above, but it still wasn’t enough as 2025 was the lowest performing summer in the eight years of my Shore Summer Weekend Weather Report Card.
How the report card is graded
Since 2018, we’ve graded the shore summer weekends from Memorial Day to Labor Day. That’s Friday to Sunday, but also Mondays for Memorial Day and Labor Day. Fourth of July is either included in the weekend or on its own. It was July 4-7 for the 2025 edition.
I say we’ve graded because you shape the report card. You helped set the criteria for the perfect ‘A’ for your summer shore weekends.
An ‘A’ requires temperatures between 75 and 85 degrees, no rain, winds between 5 and 15 mph, low humidity and sunny to partly sunny skies. This report card covers Cape May to Sandy Hook, so if it’s 90 degrees far south, but 85 degrees everywhere else, that won’t ruin a perfect ‘A’ grade.
The 2025 report card for the Jersey Shore
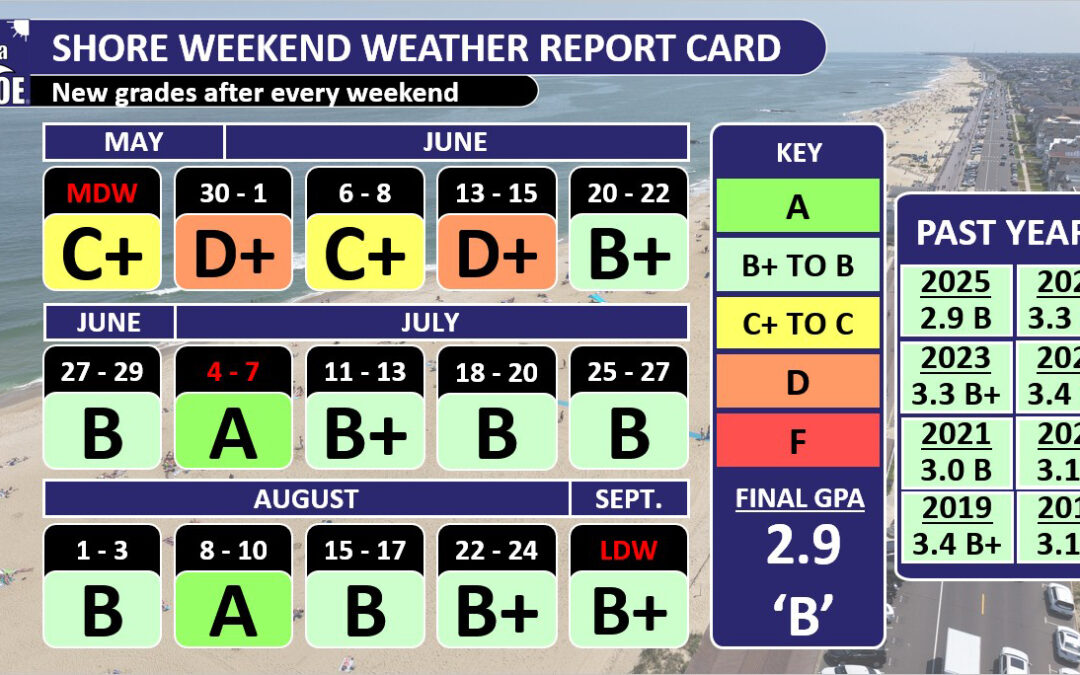
The final grade point average for the 15 summer weekends was a 2.9; good enough for a ‘B,’ but not good enough to get us out of eighth place of the eight summers I’ve graded. You have to look at the beginning of the summer to understand why.
From Memorial Day weekend to June 13-15, the weekends earned a C+, D+, C+ and D+. It was rough; so rough, we did a Shore Local article about it.
“The reason for these gloomy, cooler weekends is part bad weather luck, and part science,” I wrote on June 19.
New Jersey sat in the middle between two air masses; the jet stream floated over the state. That brought the cool, stormy weather. Then, in a stroke of bad luck, the same pattern repeated itself every seven days, on the weekends.
The warm, bright summer weather that most of us know and love doesn’t settle in until mid-June. Poor weather weekends early in the season are common. Still, 2025 was the worst start in our eight-year history of report cards up until then. After that, the Jersey Shore studied hard to bring up its grade, but 2025 never broke out of last place.
The 11 weekends, from June 20 to Labor Day weekend, were all either a B, B+ or an A. If we just looked at those, the grade point average would be a 3.3; that’s a B+! This included a perfect ‘A’ for the Fourth of July weekend. I was away on vacation, but just talking with you and seeing the weather data, it’s fair to say it was the most comfortable Independence Day weekend in years.
We also had another ‘A’ for Aug. 8-10. Like most of August, the humidity stayed low and the amount of sunlight stayed high.
This past weekend, Labor Day, earned a B+. The only downside was it was a bit too cool, in the low 70s for highs most days. However, it was plenty sunny, not humid at all and had pleasant breezes. It’s a great sign of the Locals’ Summer September to come.
This was the lowest grade in the history of the report card. However, the 2.9 is just half a point away from the highest grade earned in the summers of 2022 and 2019.
Furthermore, there was plenty of good weekend weather after Father’s Day, when summer kicks into high gear here.
Final grade point averages by year
- 2025 – 2.9 (B)
- 2024 – 3.3 (B+)
- 2023 – 3.3 (B+)
- 2022 – 3.4 (B+)
- 2021 – 3.0 (B)
- 2020 – 3.1 (B)
- 2019 – 3.4 (B+)
- 2018 – 3.1 (B)
How will September’s weather be?
Temperatures should wind up at or just below average for the month of September. I don’t see a big change on the horizon taking us out of the generally cooler and drier weather pattern we’ve been in since the beginning of August.
High pressure should generally center itself in Pennsylvania or West Virginia. That will bring us another drier-than-average month, unless a tropical system comes through.
Then, since winds spin clockwise around high-pressure systems, our winds will generally be out of the northeast. That should keep ocean water temperatures in the 70s most of the month, but also keep our on-land high temperatures mostly in the 70s as well.
So, it will be very comfortable with plenty of good days to spend by the water for Locals’ Summer September.
We do need the rain, though. While not exactly known at the time of this writing, the beach towns should wind up with a top 10 driest August on record, according to NOAA’s Southeast Regional Climate Center. The mainland was still below average, just not as much. Farther away, Millville should be the driest August on record. Drought in New Jersey spread and worsened tremendously last September. Let’s hope that doesn’t happen again.
Thanks for following the Shore Summer Weekend Weather Report Card. I hope you enjoyed seeing the grades as much as I like posting about them in my videos and on social media. Now, happy locals summer!
Joe Martucci, a Certified Broadcast Meteorologist and Digital Meteorologist, is the President and Director of Meteorology for Cup A Joe Weather and Drone. You can connect with him at cupajoe.live.