The polar vortex has been poked and distributed in the stratosphere. Now it’s a waiting game as rounds of Arctic air run through New Jersey, reload and sweep through the Northeast again for much of December.
As of Nov. 30, the time of this writing, it was unknown whether the Sudden Stratospheric Warming (SSW) occurred near the North Pole. If the stratospheric polar vortex were disturbed so much that its westerly winds reversed course, causing the SSW, and it happened in November, it would be the earliest in the satellite era (1968).
Either way, though, the polar vortex’s spinning top at the North Pole was disrupted. Much warmer-than-usual air filled into the Arctic about 100,000 feet high. The stratospheric polar vortex stretched south into North America. Specifically, it moved into Western Canada and Alaska.
The extremely cold air in the stratospheric vortex almost never mixes directly down to the surface. Instead, the SSW changes the large-scale circulation, which then allows pre-existing surface-level Arctic air (from northern Canada, Siberia, etc.) to plunge southward in the troposphere.
As of Nov. 30, that Arctic air had surged south from the North Pole to Hudson Bay and Quebec, Canada, according to Ryan Maue, a meteorologist and climate scientist at WeatherTrader.
The jet stream, the river of air about 30,000 feet high, which separates polar and tropical air masses, then becomes wavy, moving south to north, to south again. The jet stream is in the troposphere.
That clash of warm and cold air from the jet stream also causes cold-core storms, like a nor’easter to form at the surface. For now, though, let’s focus on the cold.
When will cold air outbreaks occur at the Jersey Shore?
There are three times for colder-than-average temperatures:
1. A continuation of the current cold through Dec. 6
2. Dec. 8-10
3. Dec. 14-18
These aren’t long stretches of cold, however, it will be 10 or more degrees below average for many of those days. That translates to high temperatures in the upper 30s to low 40s. For low temperatures, this means lows on either side of 20 degrees inland. Meanwhile, the shore would see lows of 25 to 30 degrees.
Remember that our coldest day of the year, on average, occurs in the second half of January. So, while they don’t sound extremely bitter for late January standards, this is not what it should feel like in early December.
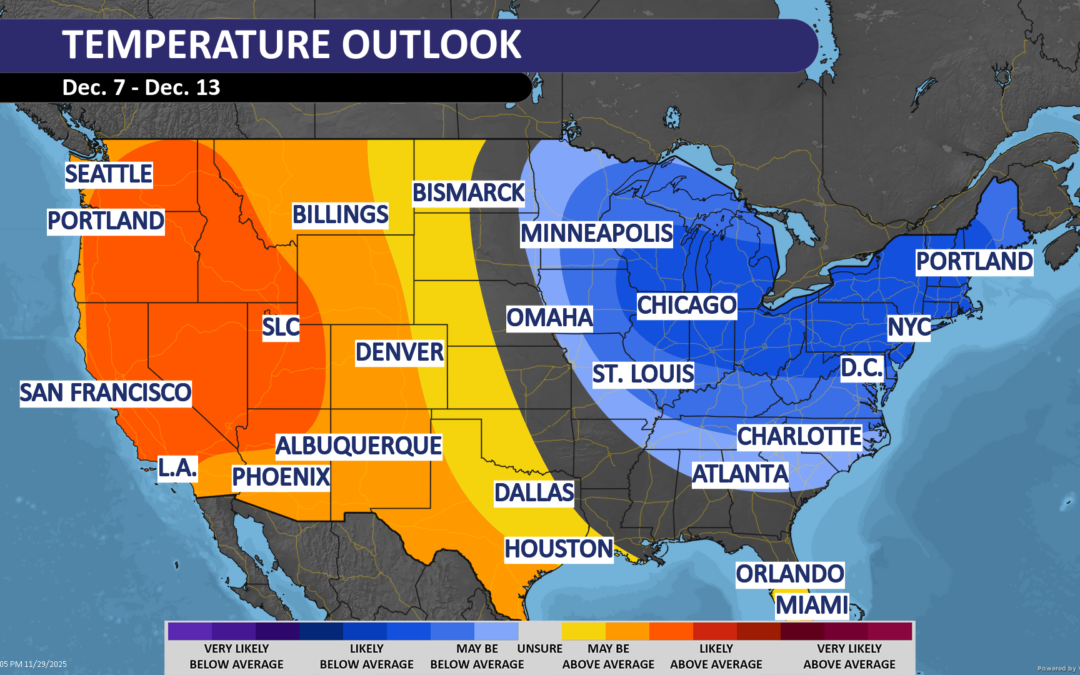
The National Oceanic and Atmospheric Administration (NOAA), forecasts Dec. 7-13 to be below average for the Northeast and Great Lakes states. However, NOAA has the most confidence on below-average temperatures for every county in New Jersey except for Cape May County – a sign that the Cape May Bubble is still strong year-round.
All kidding aside, it will be a chilly start to climatological winter, which runs from Dec. 1 to Feb. 28, the coldest three months of the year, on average.
Forecasting what days snow will fall at the Jersey Shore more than five days out is nearly impossible. I won’t do that. However, there are two forces at play. How much snow we see, or don’t see in December will prove which force was stronger.
A colder-than-average December is simply better for snow than a warmer-than-average December. It gives you more opportunity for snow. It’s that simple.
On the other hand, a pattern appeared in November. When it’s dry, it’s colder than average. When there is precipitation, it’s at or warmer than average. That cold and dry, or mild and wet pattern drives snow lovers crazy. It’s a function of the storm track being at or west of New Jersey. That brings more southerly, warmer winds around counterclockwise-spinning storms.
At the Sen. Frank S. Farley State Marina in Atlantic City, 10 days also had precipitation in November. Eight of them were above average or within a degree of average, according to NOAA. Ten days of precipitation also happened at Atlantic City International Airport; six of them were above average or within a degree of average.
To see how the polar vortex could interact for yourself, go to a weather forecast model website like WeatherBell (subscription needed) and look at the 2PVU (potential vorticity units) forecast, which looks at the boundary between the troposphere and the stratosphere.
Where you see the blues and purples indicates the outline of the polar vortex boundary. In a strong polar vortex, it is compact, circular and centered near the Arctic. If it’s not, like the first half of December, that means the polar vortex has weakened, which eventually allows frigid air at the ground to spill places south.
Joe Martucci, a Certified Broadcast Meteorologist and Digital Meteorologist, is the President and Director of Meteorology for Cup A Joe Weather and Drone. You can connect with him at cupajoe.live.