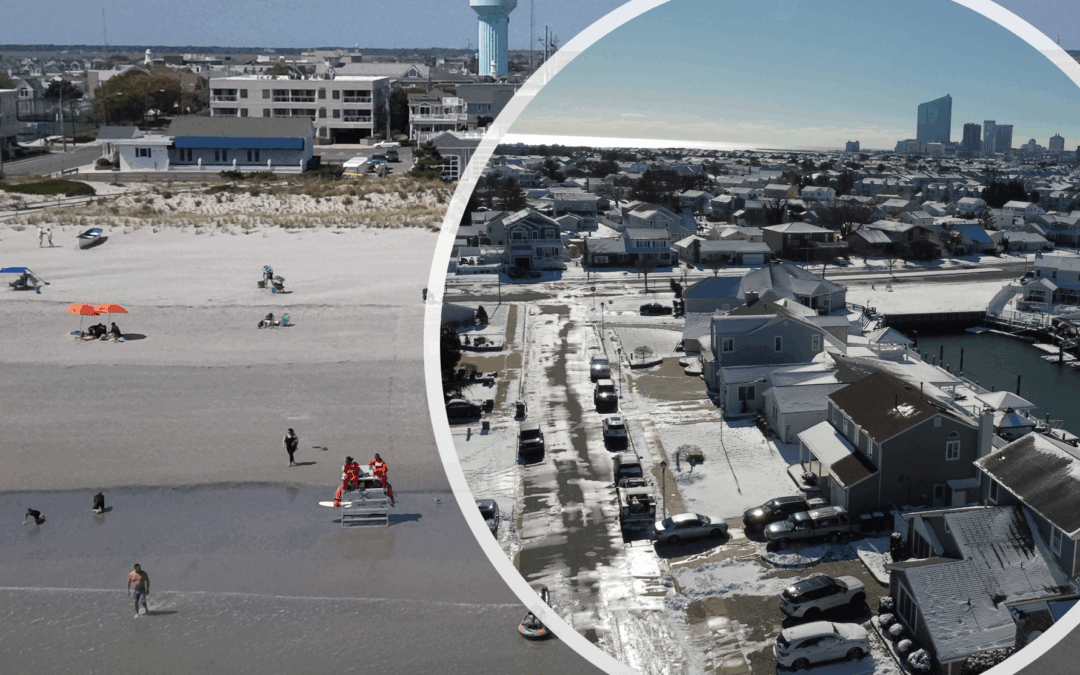
History shows that when July is hotter than usual and August is cooler than usual, like what just happened at the Jersey Shore this year, it’s a good clue about what the coming winter might be like. Here’s why past weather patterns suggest it could be colder than average.
Using information from the Office of the New Jersey State Climatologist, where I did research during my senior year at Rutgers University, I collected average temperature data for every month since 1895. I focused on the Coastal Zone, which the climate office describes as areas east of the Garden State Parkway in Monmouth, Ocean and Atlantic counties, plus almost all of Cape May County.
Snowfall data came from the National Oceanic and Atmospheric Administration for Lower Township, Atlantic City International Airport, Atlantic City and Long Branch. While Atlantic City doesn’t report snowfall anymore, they did from 1874 to the 1950s, which I used for this project.
What do a hot July and a cooler August mean for the Jersey Shore’s winter temperatures?
Going back to 1895, there have been 18 years when a cooler-than-average August followed a hotter-than-average July in the Coastal Zone. That includes 2025 when August wound up 3.2 degrees below average – 31st coolest of the 130 years of record keeping. July was 2.4 degrees above average – the sixth hottest on record. The most recent such period before that was 2017.
Average here is defined as the period of record average from 1895 to 2025. Usually, though, meteorologists use a 30-year average to discuss what is above or below average. The period of record average is cooler than the most recent 30-year average due to the changing climate.
I then investigated what temperatures were for December through March for the months following those July-August stretches. There was a strong signal for temperatures to be colder than our most recent 30-year average. The 17 years broke down like this for the four-month December-March period.
Colder than average for all four months: 3
Three months colder than average: 7
Two months colder than average: 5
One or no months colder than average: 2
In other words, 59% of years had all months colder than the 1991-to-2020 average; 12% had no or only one month colder than average.
If September is chilly, too, history says a frigid winter is likely.
September is also likely to be cooler than the period of record average, given the first 10 days of the month, as well as the forecast through at least Sept. 18.
The historical likelihood that winter will be colder than average, based on just those years, is even higher. Of the 12 times this happened, 10 had at least three months between December and March that were colder than average.
Hot July, cool August: Snowy winter at the Jersey Shore?
The history books don’t show a clear link between a super-hot July and a cooler-than-usual August when it comes to snowy winters. Here’s what we found about snow at four Jersey Shore weather stations after 17 winters with that kind of July and August:
Lower Township: 6 winters had more snow, 7 had less.
Atlantic City International Airport: 3 winters had more snow, 9 had less.
Atlantic City: 3 winters had more snow, 4 had less.
Long Branch: 6 winters had more snow, 4 had less.
Each weather station has been around for different amounts of time, so the number of years checked isn’t the same for all. But if you love snow, you might be excited to know that the last two times this happened (the winters of 2017-’18 and 2013-’14), there was more snow than usual. Also, if September is cooler than normal, the chances of a snowy winter go up. Out of 12 years with a hot July, cool August, and cool September, most had more snow than average.
Does history matter when it comes to this winter’s forecast?
September is in the middle of the August-to-October time frame that long-range forecasters typically use to do their winter forecasts. As part of their research, they look at what the weather in previous springs and summers was like. They then look at what the following winter was like to give them an idea of what to expect. So if, for example, 2017 had conditions similar to 2025, they’d look at the winter of 2017-’18 to give New Jerseyans an idea of what this winter will be like.
They’re called analog years in the weather world. While each forecaster has their own winter formula, analog years are a part of the process, but usually not the main source of information they use.
I don’t do my own winter forecast. However, look for a winter forecast by the top Northeast experts in October. We can read whether they used the winter of 2017-’18 or 2013-’14 as an analog year.
9/11 at the Jersey Shore
In this Shore Local Weather Column, published on Sept. 11, let’s reflect on the tragic events of Sept. 11, 2001. That day brought uncertainty, pain and incredible strength to our nation. As Alan Jackson’s song asks, “Where were you when the world stopped turning?”
If you’re old enough to remember, take a moment to think back on where you were. You might also consider visiting one of the 9/11 memorials along the Jersey Shore. My favorite is in Absecon – it’s powerful, with a lifelike replica of the Twin Towers that’s both beautiful and deeply moving.
Joe Martucci, a Certified Broadcast Meteorologist and Digital Meteorologist, is the President and Director of Meteorology for Cup A Joe Weather and Drone. You can connect with him at cupajoe.live.


